At runtime, you can use the right-click context menus to interact with the discoveries in your presentation and perform further analysis of your data on the fly. This lets you explore your data more fully than you could do in a PDF or other non-interactive format.
The right-click context menus always show functionality related to the selected item. As an example, the context menu that you see when you right-click a discovery differs from that of a legend or slicer.
Context Menu Configuration
What appears on your context menus can be controlled in the following manner:
- Your administrator can select the functions that you should be shown in the Runtime Settings.
- The structure of your context menu depends on your settings in User Defaults. For more information, see Context Menu Configuration.
Context Menu Items
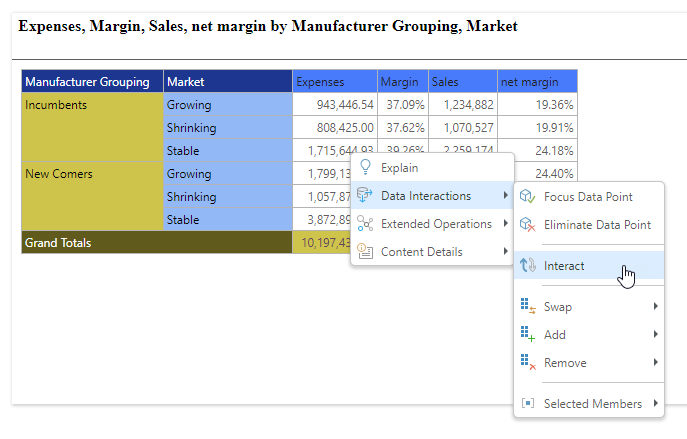
Note: The preceding image shows the context menu where a data point is selected in the visual and where the New Context Menu setting is "on." Different options may be shown where different content is selected.
|
Function (A - Z) |
Details |
|---|---|
|
Run any actions that have been built for the selected content item or items. Actions allow your users to jump to another place in the presentation (slide, mini-tab, or content item), open a URL, or open a tooltip at runtime. Actions can also allow your users to run some JavaScript that you wrote, causing a custom behavior. |
|
|
Add a selected hierarchy to the query. |
|
|
Open a discovery in the Discover Lite tool. Note: You can edit and save the discovery from this view. This is particularly useful if you want to edit your discovery and save your changes. |
|
|
Build a new alert for the given data point. This option is only enabled once the presentation has been saved. |
|
|
Change Visual |
Change the visualization type that is currently used by the discovery. For example, to change a grid into a pie or area chart. There are two sets of options on the Change Visual menu, both of which change the appearance of your visual for analytic purposes:
|
|
Conditional Formatting |
Highlight important items using mathematical or logical rules and graphical adjustments to the underlying chart or grid. |
|
Copy |
Copy a data point or value from your visual by right-clicking that value in your visual and selecting one of the following options from the Copy menu:
|
|
Copy Content:
|
Copy data from your visual so that it can be pasted into a third-party tool, such as Microsoft Excel. For any visualization type apart from Maps, right-click your discovery's background and select one of the Copy Content options:
Warning: There is a copy limit of 400,000 cells. Tip: When you copy data to your clipboard, the format used is typically suitable to be pasted into Microsoft products. You can change the default format type for your clipboard data in your User Defaults (General > Clipboard Mode). |
|
Dice a member by another hierarchy. |
|
|
If the discovery contains a user hierarchy, right-click on a member to drill down, drill up, or drill to a specific level. When working with charts, access these functions by right-clicking on the members listed in the chart's legend. |
|
|
Expand Down and Collapse |
If the discovery contains a user hierarchy, right-click on the member rows to expand down to the next level. To collapse a level, right-click on its parent level and select Collapse. When working with charts, access these functions by right-clicking on the members listed in the chart's legend. |
|
Open the Explain dialog to generate insights into the factors driving, or contributing to, a data point of interest. |
|
|
Focus or Eliminate Data Point |
Focus or eliminate a data point or a member. Right-click on the relevant data point. For example, for grids, this is a cell. |
|
Information |
View a summary of the selected discovery, including its filters (the measures it contains), statistics (the number of columns, rows, and cells it contains), and its metadata. |
|
Where an interaction has been configured, the Interact button is enabled. You can use this option to cross-filter discoveries. |
|
|
Use this option to copy a special URL or Snippet to your clipboard. You can then use this link to read the result set of the item's query into another client technology that consumes data (for example, Microsoft Excel). |
|
|
Switch the axes:
|
|
|
Print Report |
Prints the currently selected visual item. Options are provided to print (Export) the selected item in a variety of different formats. See Print and Export for more details. |
|
Quick filter by the top or bottom count or percent. When working with grids, right-click on a measure header for this option. |
|
|
Quick sort according to values or labels. When working with grids, right-click on a measure header for this option. You can also open the runtime Sort wizard from this submenu. |
|
|
Rate Item |
Assign a rating to the given item. |
|
Remove the selected hierarchy from the query. |
|
|
Right-click anywhere on your presentation background to open this option. If it is enabled on the menu, then one or more slicers have been updated but the associated filtering has not yet been applied to the presentation (Auto Run is off for one or more slicers). |
|
|
Selected Members / Member Selection |
Select the relevant member, and then dice it by another hierarchy, or focus or eliminate it. |
|
Show Workflows or Conversations |
Show existing workflows or conversations. |
|
Start a new workflow or conversation. |
Start a new workflow or conversation. |
|
Swap the selected hierarchy for another one. |
|
|
Totals |
Access the Totals functions. For grids, right-click on the background or header. |